The Commute: How Successful Are The MTA’s New Bus Routes? Part 2 Of 2

THE COMMUTE: Yesterday, we showed how the average number of passengers carried per bus for routes discontinued in 2010 was 17.06. New York City Transit (NYCT) instituted five new routes in 2009, 2011, 2013 and 2014. These were the B32, B84, Bx24, Bx46, and M12. They also reinstituted the B37 and B39; the B67 was extended to Williamsburg. The B32 carries an average of 11.25 passengers per bus trip; B39 – 5.53; B84 – 7.65; Bx24 – 8.75; Bx46 – 7.71; M12 – 1.85 5.55 (assuming ridership would triple if the route operated for all of 2014 instead of for four months). Since the B67 was an extension, we assumed that all the new 292 daily passengers rode the route because it was extended. Therefore, a bus along the extension carried an average 3.4 passengers per trip. The B37 operated for six months, so if we double the patronage we get 17.75 gets 8.75 passengers per trip. The average of those averages for new routes only is 6.63 6.77. The two reinstituted routes average out to 11.64 7.14 passengers per bus trip.
There are 182 local bus routes operated by NYCT. The re-instituted B37 ranks 171 by weekday patronage but really should rank 162, which I will explain shortly; the B32 ranks 175; Bx24 ranks 177; Bx46 ranks 178; B84 ranks 179; the reinstituted B39 ranks 181, and the M12 ranks 182.
Why are these routes performing so poorly? One reason is that they all operate at only 30-minute headways, except for the B37, which has a 20-minute schedule. Another is that some are poorly designed such as the B32 and B67, which I discussed here, since they are not conducive to transferring. Meanwhile, we have real routing needs that are not being met here, here, here, here, here, here, here, here, and here. There are additional proposals on my website. How many times do I have to re-emphasize this point before the MTA takes heed?
Conclusion
The MTA’s meager attempts to keep up with changing demand have been a miserable failure, which is a major reason bus patronage is declining. Instead of the new routes carrying more passengers per bus than the routes that were discontinued, they carry far less: 6.63 6.77 as compared to 17.06. The discontinued Bx14 from Parkchester to Country Club in the Bronx, which carried an average of 26 passengers per bus, was replaced with the Bx24 from Pelham Bay to Country Club, which carries 8.75 passengers per bus.
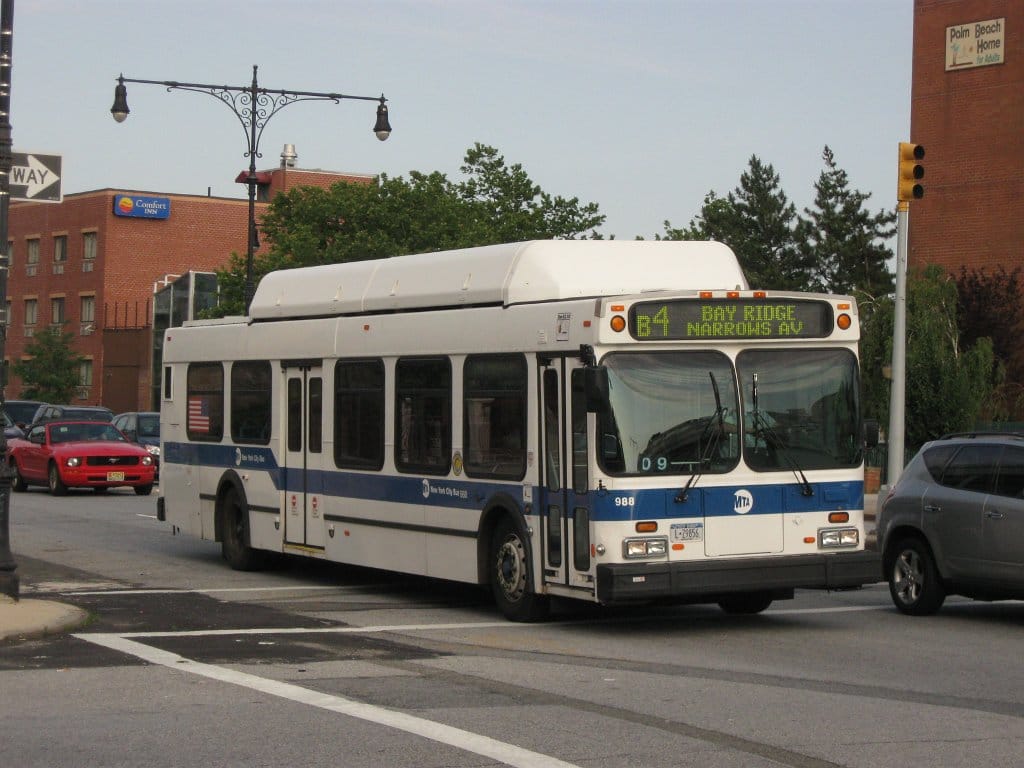
To put these numbers in perspective, the Q4, which ranks as the median local NYCT bus route in patronage, carries 69 passengers per bus trip; the underutilized B4 ranks 130 out of 182 carries 50.38 passengers per trip. So not only do the new routes carry less than half the number of passengers per bus than the routes the MTA discontinued in 2010, they all rank at the bottom of the list patronage-wise.
Let’s face it: The MTA just does a poor job of planning local bus routes. They made the B48 operate more inefficiently by cutting it back in 2010, as evidenced by its resurgence with a whopping 50 percent patronage increase after the short distance it was cut from Empire Boulevard to Fulton Street was restored. The weekday cost per passenger on the B64 rose by 41 percent after its cutback.
All the mistakes the MTA makes are not evident because little data are revealed. Once I discovered two side-by-side tables in which the MTA confused round trips with one-way trips. In the average weekday ridership chart, all routes are considered to have operated the same numbers of days a year although some routes only operated for four or six months. That is why the B37 rank is incorrect. (The M12 rank of 182 should be 181.) The mistake is obvious if you divide the annual ridership by the average daily ridership for a route operating the entire year and compare it to the M12 that operated only for four months. You get nearly the same number for both. If you do the math, average weekday ridership apparently also includes weekends and should more accurately be titled average daily ridership.
Hey, you are dealing with the MTA and they make the rules.
The Commute is a weekly feature highlighting news and information about the city’s mass transit system and transportation infrastructure. It is written by Allan Rosen, a Manhattan Beach resident and former Director of MTA/NYC Transit Bus Planning (1981).
Disclaimer: The above is an opinion column and may not represent the thoughts or position of Sheepshead Bites. Based upon their expertise in their respective fields, our columnists are responsible for fact-checking their own work. Their submissions are edited only for length, grammar and clarity. If you would like to submit an opinion piece or become a regularly featured contributor, please e-mail nberke [at] sheepsheadbites [dot] com.
Correction (May 13 at 8:30am): Due to a misreading of the numbers, some of the math in this report was erroneous and has been updated. Strikeouts have been used to show the changes.