Rising Prices and Gentrification by the Numbers

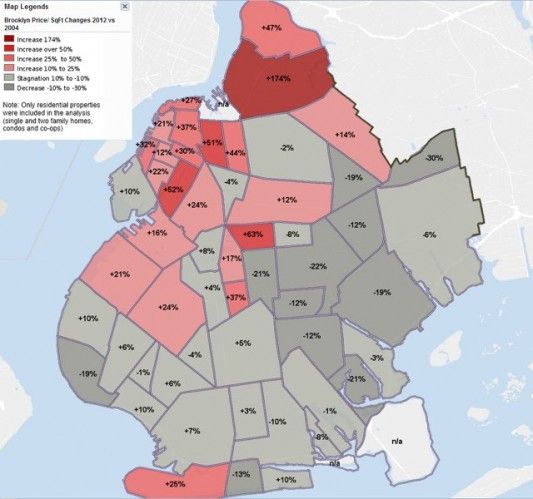
If anyone wasn’t sure that Ditmas Park has changed a lot in the last decade, here’s some math to back that claim up. Call it the Brooklyn Gentrification Map courtesy of Property Shark via Gothamist. The map tracks price per square foot since 2004.
Ditmas Park prices by square foot are up 37% from 2004 and Prospect Park South prices are up 17%. Flatbush is down 21%. The biggest change in our area and the second biggest in the borough is a 63% jump for Prospect Lefferts Garden. Only Williamsburg prices jumping an unreal 174% tops it. Maybe it’s time to move to one of those islands in Jamaica Bay — that seems like steady real estate.
Are there any numbers that surprise you here?
Map: Property Shark