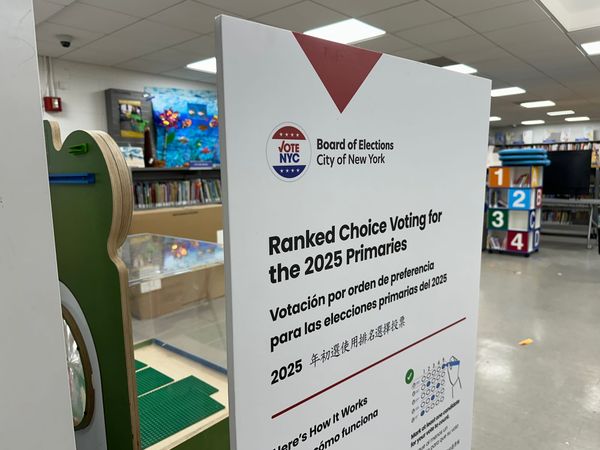
Pulaski Bridge Bicycle Lane a Tentative Success


Frustrated with the slow pace of data on bicycling made available by the Department of Transportation (DOT), Bike New York, which organizes the five-borough bike tour each year, released their own study this week of the Pulaski Bridge bicycle path.
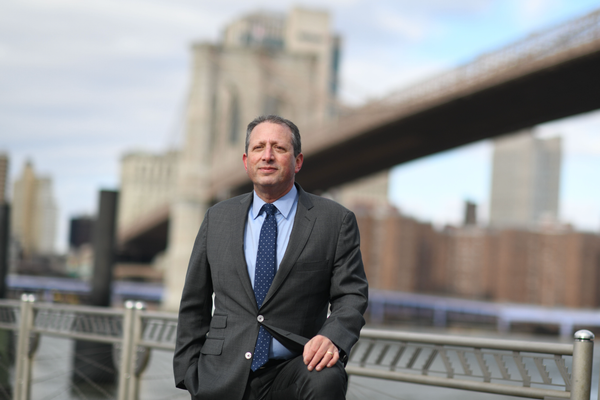
“[City’s] official sources of data on bike riding in the city are showing different things. We’re trying to understand what is actually going on — maybe cycling is increasing in some parts of the city and not in others?” Jon Orcutt, the Communications Director of Bike New York, wrote to Bklyner in an email about the goal of the study. “The Pulaski count is part of a bigger study — we’ll be doing counts in other areas and looking in detail at CitiBike data, which is by far the most detailed info you can get on bike trips in New York City.”
While trying to obtain more biking data for the Pulaski pathway that was installed in 2016, Bike New York reached out to the DOT for data from the counter that had been installed to track ridership. This was back in February of 2019 and DOT wrote, “Bike count data for the Pulaski Bridge is not yet available.”
“No, we didn’t tell [DOT] that we were doing [the study],” Orcutt clarified on the issue. “We did ask the Department in February to make all of its bike counts public, but have not received a response.”
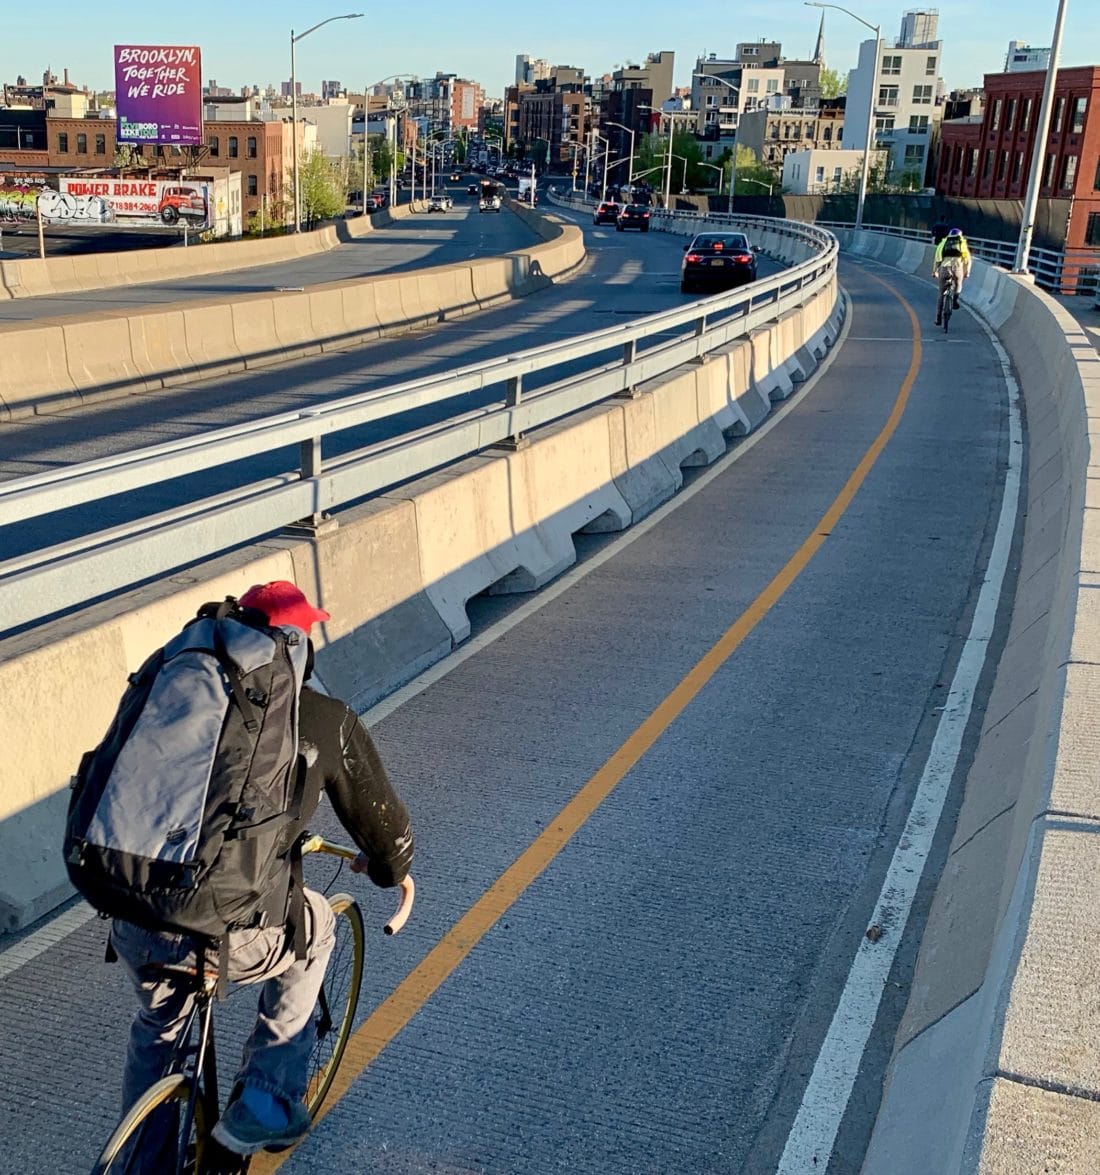
So Bike New York stood near the path with a clicker and counted bikes passing by manually during multiple days at different peak and non-peak times to collect data for the study. The DOT told Bklyner this week that “The [bike] counters are working and we are hoping to have the data publicly available within the next few weeks.”
Numer of Bicycle Trips Increased Since Separate Path Installed
They counted an average of 142 bicycles per hour during peak commuting times and 53 bicycles per hour during non-peak times in November. That compares to an April 2013 NYC DOT 12-hour count that found 99 bicycles per hour prior to the establishment of separate walking and cycling paths on the bridge in 2016. Both April and November are transitional cycling months between the May-October peak season and colder winter months, with fewer cyclists out on the road.
According to the Bike New York study, CitiBike trips were 21% of observed bike trips. In a 2015 observation in Midtown Manhattan, Transportation Alternatives noted that “CitiBike trips are a peak commuting-time phenomenon” with over twice the usage in peak periods than non-peak. CitiBike trips in the morning peak were overwhelmingly from Brooklyn to Queens, and in the reverse direction in the evening peak, the study found, suggesting that CitiBike is heavily used to bring north Brooklyn commuters to subway lines in Queens in the morning, and back from those subways in the evening as Greenpoint has no subway line that runs directly to Manhattan.
The Rise of Motorized Scooters & E-bikes
Purely motorized vehicles such as e-scooters and Revel mopeds have a regular presence in the bike path as well, the study found. These vehicles made up 7.2% of all observed crossings of the bridge that used the bike path.
Motorized vehicles are not legally allowed in NYC bike lanes/paths today. A number of e-scooter, Revel and e-bike riders were “flooring” their devices, Bike New York notes, creating speed differentials with bike riders that could create safety problems or make bike riders less comfortable using the path. Bike New York observed similar growth of motorized vehicle use on the Williamsburg and Queensboro Bridges as well.