Parking Ticket Revenue Down In Brooklyn, For Now


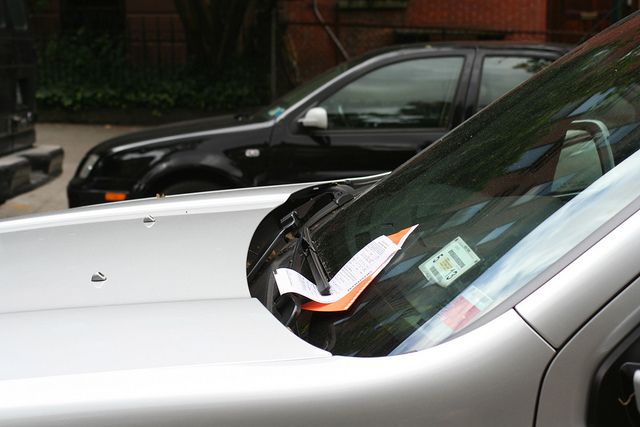
If you are curious which neighborhoods paid the most in parking tickets, RentHop just released a report and data visualization based on Open NYC Data, comparing the tickets issued and paid by neighborhood over the last two fiscal years.
Revenue from all tickets is down 15 percent, according to the data, and about 17 percent down from parking tickets — $410 million in 2016 versus $497 million in 2015. How likely is it that this trend will continue given the budget uncertainties is anyone’s guess.
When you look at the data for Brooklyn, a few things stand out.
- The 70th Precinct, which covers Ditmas Park, Flatbush, and Midwood, leads the borough both in the number of tickets issued to passenger cars, as well as revenue generated from those tickets.
- At $9.5 million collected from non-commercial vehicles, that revenue is down year on year, almost 9 percent.
- But it is almost a million and a half dollars more than the next precinct in Brooklyn, 61st, covering Sheepshead Bay. Wrongful ticketing may account for a part of it, but that still leaves a lot of questions unanswered.
- Average ticket revenue $61.
Brooklyn Heights leads in tickets per capita, followed by Fort Greene and Park Slope. All of these areas have relatively small residential populations and are substantial commercial destinations, which may account for some of the differences.
Among other interesting facts:
- Last year, the city collected over $113 million dollars in passenger car parking tickets in Brooklyn.
- About half of that money came from neighborhoods in southern Brooklyn.
- The most expensive average tickets (before late fees) seem to be East Flatbush, East New York, Canarsie, Bedford – Stuyvesant and PLG, where averages are all above $70 and up to $73.
- According to the latest census data, as of 2015, some 43.7 percent of households in Brooklyn own at least one car, a number that has not changed much since 2010.
Here’s how the neighborhoods stack up:
- $9,523,095 Flatbush / Ditmas Park (70th Precinct)
- $8,085,245 Sheepshead Bay / Manhattan Beach (61st Precinct)
- $7,950,850 Brooklyn Heights (84th Precinct)
- $7,540,505 Borough Park (66th Precinct)
- $6,843,135 Williamsburg (90th Precinct)
- $6,337,025 Bensonhurst (62nd Precinct)
- $5,976,745 Bay Ridge / Dyker Heights (68th Precinct)
- $5,672,930 East Flatbush (67th Precinct)
- $5,296,745 Park Slope / Prospect Park (78th Precinct)
- $4,759,090 Greenpoint (94th Precinct)
- $4,730,085 Crown Heights 77
- $4,634,550 Greenwood / Sunset Park 72
- $4,225,210 Bedford Styvesant (79th Precinct)
- $4,190,330 East New York (75th Precinct)
- $4,052,785 Fort Greene (88th Precinct)
- $4,020,230 Prospect Lefferts Gardens (71st precinct)
- $3,757,475 Bushwick (83rd Precinct)
- $3,636,550 Flatlands / Bergen Beach (63rd Precinct)
- $3,220,735 Brighton Beach (60the Precinct)
- $2,543,680 Canarsie (69th Precinct)
- $2,276,795 Brownsville (73rd Precinct)
- $1,947,020 Carroll Gardens/Red Hook (76th precinct)
- $1,933,590 Bedford Styvesant (81st Precinct)


