Map Shows A Year In Gun Violence Citywide, Including Deaths And Injuries In Fort Greene-Clinton Hill

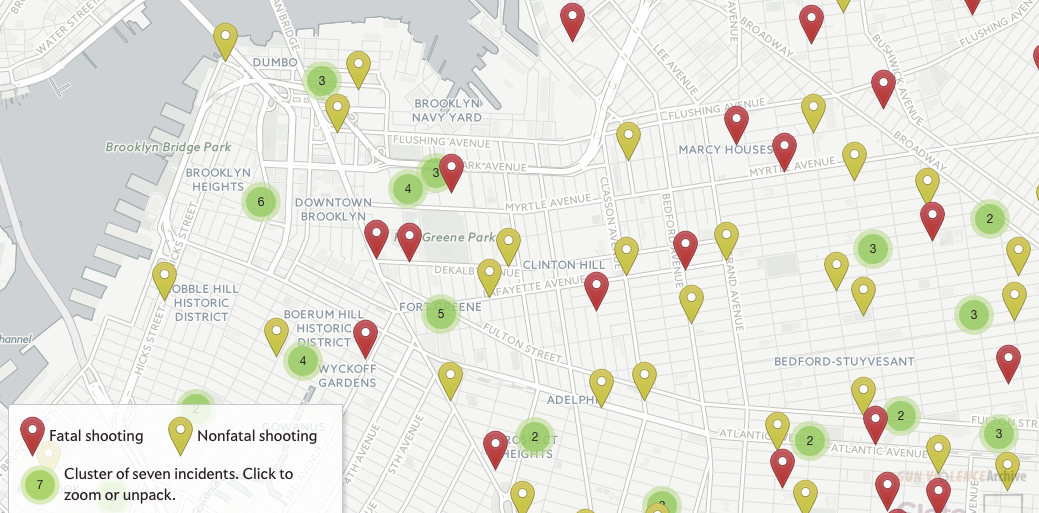

With the proliferation of shootings — some fatal, some not — in Fort Greene and Clinton Hill this year, it doesn’t really come as a surprise to see so many red, yellow, and green arrows on this map of the past 12 months in shootings, compiled by the non-profit Gun Violence Archive and mapped out by
Slate and The Trace.As Gothamist noted last week, though, the data only includes shootings where people were injured or killed by others, so any suicides or sounds of shots fired that we heard but that didn’t hit anyone were not counted.According to the data, between December 5, 2014 and December 5, 2015, there were seven (7) shooting deaths and 11 injuries in Fort Greene, and one (1) shooting death and four (4) injuries in Clinton Hill.
Most of those incidents occurred in the first half of the year, although the spate of deaths in Fort Greene all occurred in the fall/autumn.
According to Slate and The Trace, the map will be updated every three months and will continue to show the latest year of data, including links to news articles and information about who was shot and arrested.