Interactive Tool Helps You Choose The Best Elementary School For Your Child

Finding the right school for your child can be an overwhelming task. Yuri Nazarov, a father of three from Bensonhurst, found that out firsthand when he began researching kindergarten programs for his oldest child.
Nazarov and his wife discussed their options. Public schools, charter schools, magnet schools, and private schools were all on the table. But Nazarov learned that information on students’ performance at these schools were not easily accessible in one place. For private schools*, math and English standardized test scores were not available online at all, and the state would only provide the data upon request.
So Nazarov, who happens to be a metrics developer by trade, decided to create his own system. The resourceful dad reached out to the state’s Department of Education, and using the data crunching platform Tableau Public, he created an inventory of New York State’s schools statistics to help other parents make sense of the options available to them.
Of course, test scores don’t tell the full story, so Nazarov also created the Facebook group Bensonhurst Parents & Schools — now with more than 600 members — where local parents can share resources and crowdsource the answers to their education-related queries.
Disclaimer: Some of our area’s highest performing schools — like Big Apple Academy and Success Academy — are also the most controversial, tending to be either loathed or loved, with little in-between. Parents can visit Inside Schools for a more qualitative analysis of individual schools.
The easy-to-use chart Nazarov created allows parents to find the top performing schools, based on math and English scores, while controlling for factors like district, geographic area, special learning needs, race, and religious affiliation.
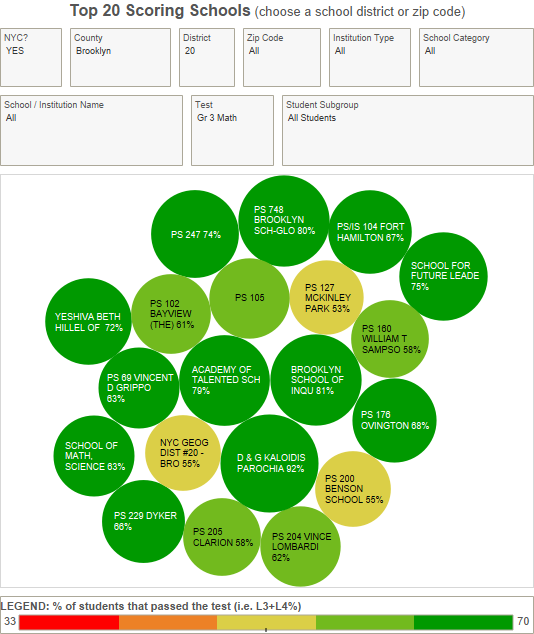
Two more tabs allow parents to visualize which 20 schools are best for their child in a color-coded bubble or square chart, with bubbles growing greener and larger for better-performing schools.
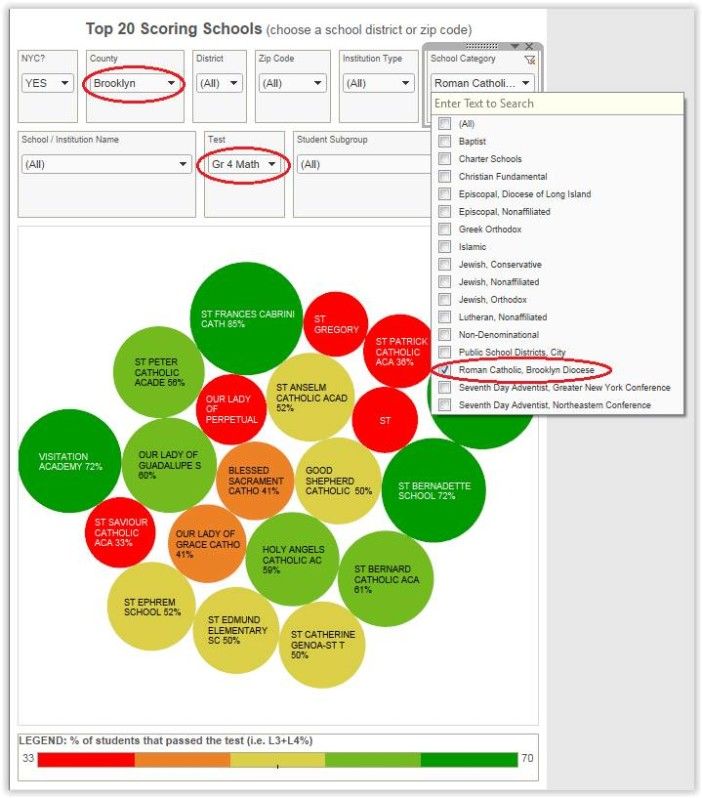
For example, below is a bubble chart of the top 20 Catholic schools in Brooklyn ranked by percentage of 4th graders who passed math (our own Saint Bernadette‘s is high on the list):
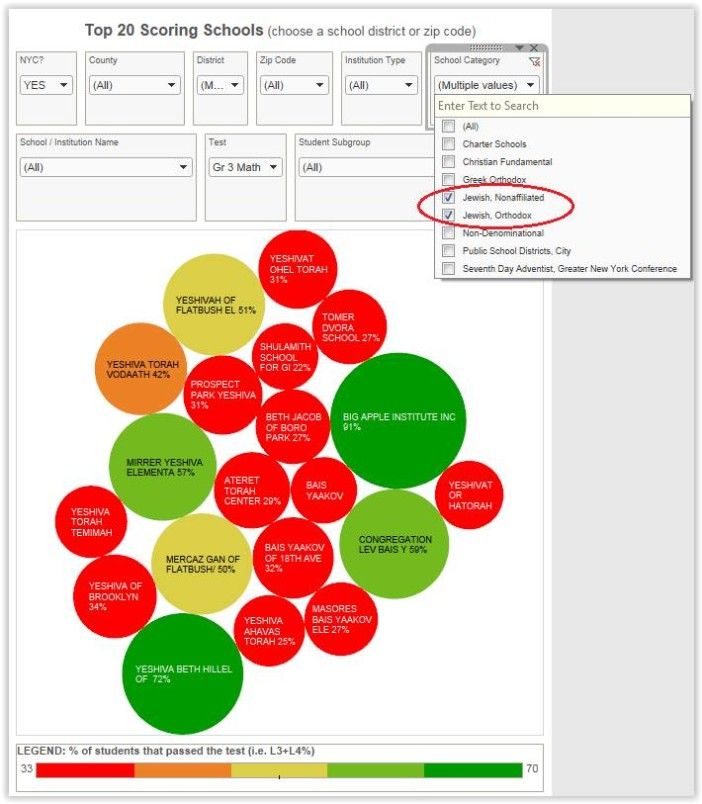
Interested in Jewish schools? Here are your options in southern Brooklyn:
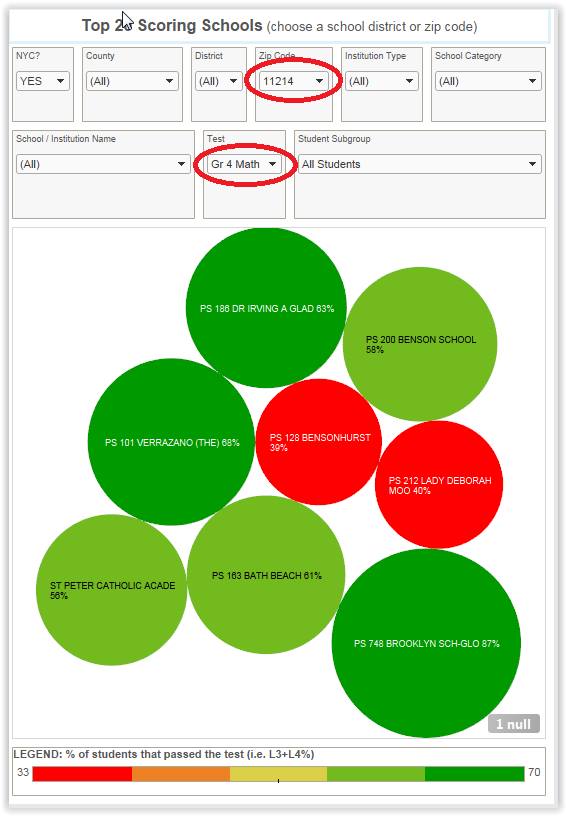
Similarly, if geographic convenience is important to you, these are the top performing schools, both public and private, when it comes to 4th grade math in zip code 11214:
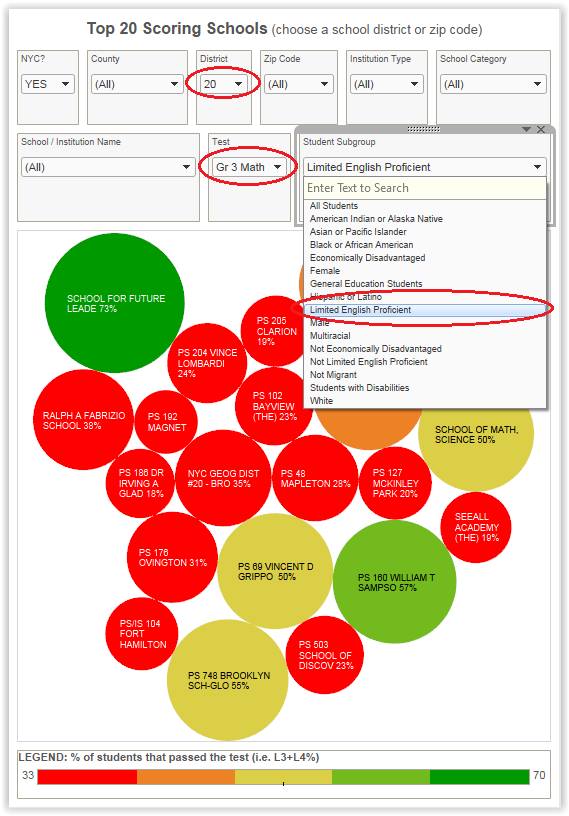
The more the criteria are narrowed down, the more useful the chart becomes. For example, say you are a newcomer to this country, live in District 20, and it’s important that your children who are still learning English perform well in math — well, then P.S. 310 School For Future Leaders is probably the school for you:
Here’s another cool use for the system. According to the data, only one school district in Brooklyn is passing more than half of its economically disadvantaged students in math: District 20.

In other words, poorer kids from southwestern Brooklyn have significantly better educational outcomes than low-income kids in other parts of the borough. That is pretty useful information for less affluent families deciding where to raise their children.
What do you think of this program? Do you find it helpful? What would you change? Share your thoughts in the comments. For questions or to report bugs, Nazarov can be reached at 29c2a79f@opayq.com.
*Editor’s note: Some of the private school don’t do standardized testing — district and charter schools are mandated to participate in the testing, but private schools aren’t. Also, some private schools hold standardized tests only in a couple of grades.