Data Check: Recent COVID-19 Infection Rates Vary Widely By Neighborhood

UPDATED WITH CURRENT DATA
Mayor Bill de Blasio and Chancellor of Education Richard Carranza recently remarked how the city is at 1-2% infection rate citywide, and how that number is going to be used to determine the reopening of the city’s public schools – currently set to open if infection rate remains below 3% citywide.
Well, NYC is a big city and a very segregated city, and while elementary school children tend to stay in their neighborhoods, middle and high-schoolers travel significant distances across neighborhoods, so I was interested to see how well we are doing on the neighborhood level in containing the virus. The city shares this data in aggregate, cumulative numbers, which are really not telling you much about what is happening week to week or month to month as people catch the virus, get tested, get well or die.
!function(){"use strict";window.addEventListener("message",(function(a){if(void 0!==a.data["datawrapper-height"])for(var e in a.data["datawrapper-height"]){var t=document.getElementById("datawrapper-chart-"+e)||document.querySelector("iframe[src*='"+e+"']");t&&(t.style.height=a.data["datawrapper-height"][e]+"px")}}))}();
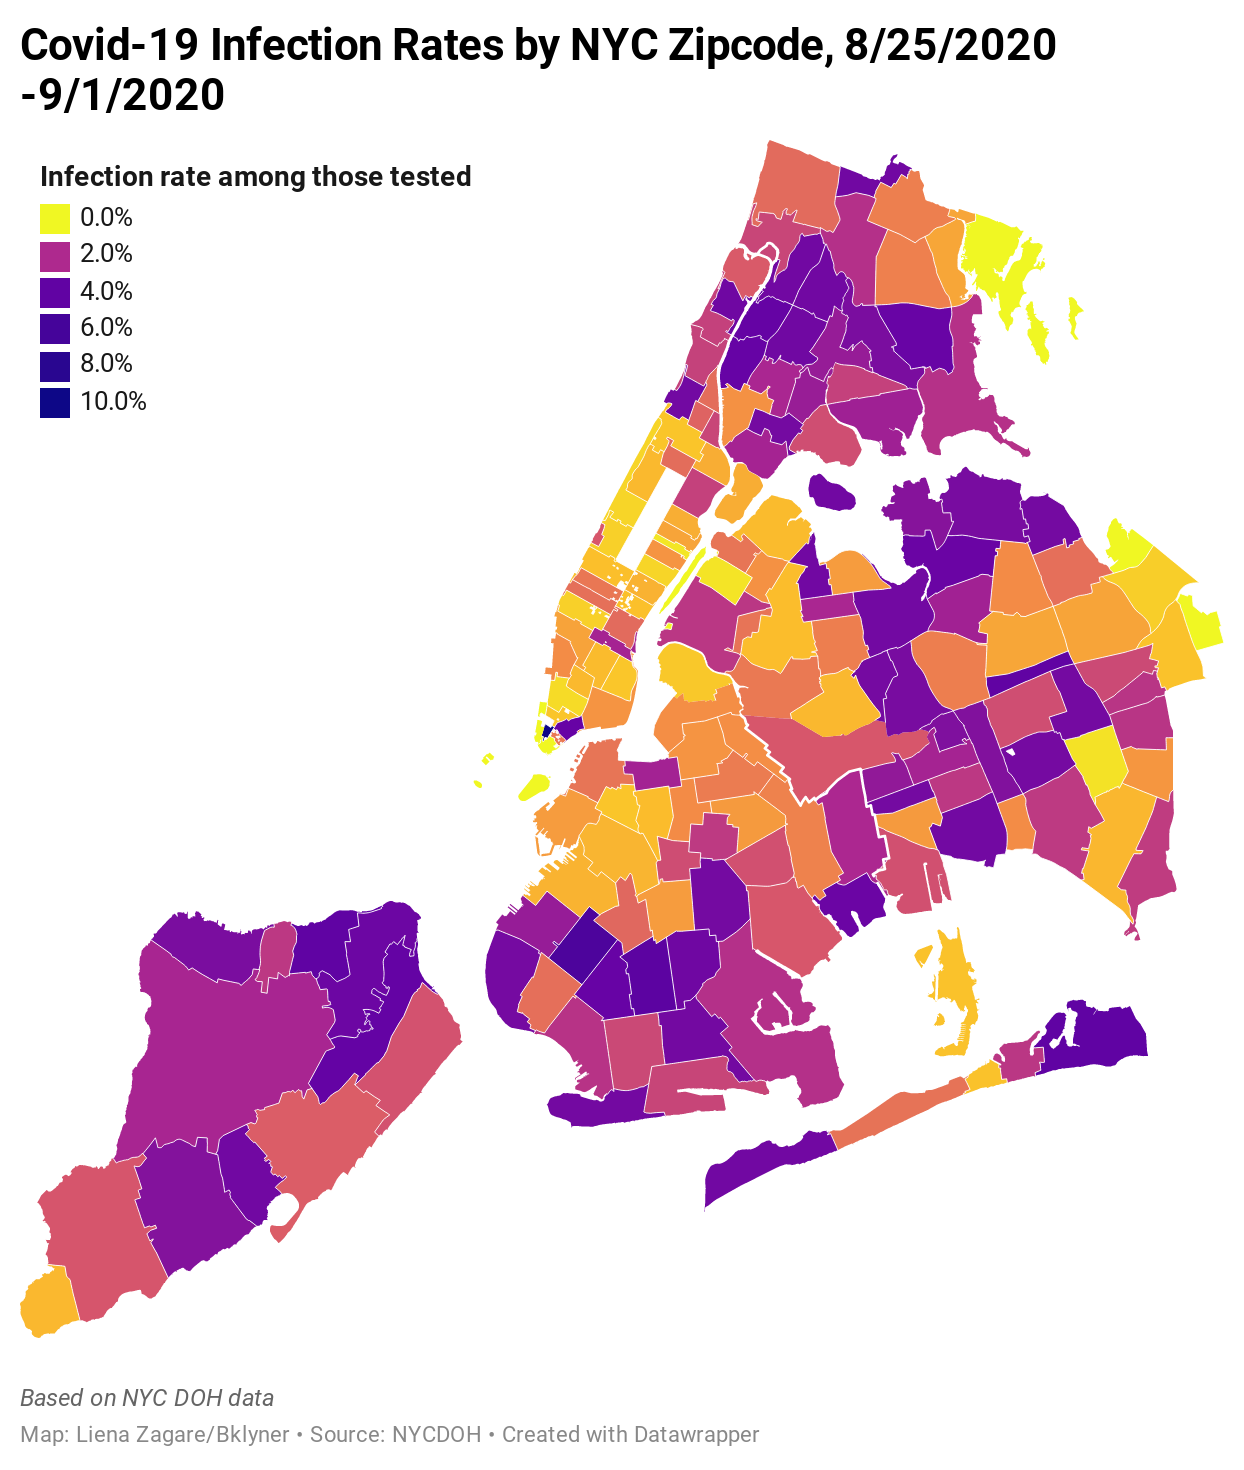
We mapped the city’s data to see how many people are getting tested where (as% of total residents in a neighborhood) and how many of them are testing positive. When you hover above the various colored dots, you can see more data for each neighborhood, as well as data for each neighborhood in a borough. The line at 3% is the threshold the city believes is ok to open schools. As you can see, quite a few neighborhoods are above, and quite a few just below the line.
Just a note on the data – as you all know, and hopefully have not had to experience yourself, tests can take a long while to get back (my father in law clocked in at 17 days).
For example, many neighborhoods were reporting infection rates among those tested in July (as reported by the city for 7/1-7/31 on August 4) above or close to the 3% threshold, and they seem to overlap well with areas that were hardest hit by the pandemic in the first place:
!function(){"use strict";window.addEventListener("message",(function(a){if(void 0!==a.data["datawrapper-height"])for(var e in a.data["datawrapper-height"]){var t=document.getElementById("datawrapper-chart-"+e)||document.querySelector("iframe[src*='"+e+"']");t&&(t.style.height=a.data["datawrapper-height"][e]+"px")}}))}();
In Brooklyn, Sunset Park was most impacted in July – 3.79% of those who took a test tested positive – triggering a city response and deployment of rapid testing in the community.
“We saw in the week of August 12th, the positivity rate go up and it got at one point as high as 4.2%, but we were able to knock it down quickly with this rapid effort. And now, today, the latest measure from Sunset Park, 1.30% positivity rate in that community. So, that’s an amazing example how quickly you can turn things around if you put the effort in the right place,” Mayor Bill De Blasio said at his press conference on September 2.
Following the extensive outreach – more than 10,000 tests, more than 20,000 doors knocked on, and more than 400,000 phone calls made, according to Ted Long, Executive Director of Test and Trace Corps – the infection rates in Sunset Park seem to have come down.
However, Borough Park now seems to be a hot spot with 5.44% infection rate among those tested, and Midwood is close by at 4.36%. The 10% infection rate in the Financial District seems to be an outlier – only 30 people got tested, and of those three tested positive.
“So, right now, that effort is underway in Borough Park, Brooklyn. We have seen an uptick,” Mayor confirmed. “We’re addressing it rapidly with more testing, with more outreach, more free masks being provided, reminders to folks how important it is to get tested, reminders how important it is to practice social distancing and to limit gatherings. That effort is going on intensely as we speak and working with community leaders and community organizations who have really helped to lead the way. And a special thank you to the Hatzalah ambulance corps, which has been in the lead of this effort, educating members of the community and letting them know how important it is to pay attention to these crucial rules and get tested.”
!function(){"use strict";window.addEventListener("message",(function(a){if(void 0!==a.data["datawrapper-height"])for(var e in a.data["datawrapper-height"]){var t=document.getElementById("datawrapper-chart-"+e)||document.querySelector("iframe[src*='"+e+"']");t&&(t.style.height=a.data["datawrapper-height"][e]+"px")}}))}();
“The Test & Trace Corps works closely with the Health Department to identify these locations. The criteria is high positivity and low testing rates relative to the surrounding areas and city,” Karla Griffith, spokesperson for the Health + Hospitals informed us via email when asked to elaborate on what triggers increased testing.
!function(){"use strict";window.addEventListener("message",(function(a){if(void 0!==a.data["datawrapper-height"])for(var e in a.data["datawrapper-height"]){var t=document.getElementById("datawrapper-chart-"+e)||document.querySelector("iframe[src*='"+e+"']");t&&(t.style.height=a.data["datawrapper-height"][e]+"px")}}))}();
In July, despite extensive outreach and a capacity of 50,000 tests a day, according to the Mayor, the number tested was just over 400,000 or about 14,000 a day on average. There were only two days where over 36,000 people got tested across the city, and the numbers have gone down since mid-July.
This can be at least partly explained by people getting tested post-George Floyd Protests in late May and June, and the length of time some of the results take to get back, as commercial labs got overwhelmed with cases rising in the rest of the country, with some individuals waiting for weeks to get results:
!function(){"use strict";window.addEventListener("message",(function(a){if(void 0!==a.data["datawrapper-height"])for(var e in a.data["datawrapper-height"]){var t=document.getElementById("datawrapper-chart-"+e)||document.querySelector("iframe[src*='"+e+"']");t&&(t.style.height=a.data["datawrapper-height"][e]+"px")}}))}();
The New York Times reported on July 24 that the median wait time was about 9 days for results, which compromises the city’s ability to effectively trace the contacts of those testing positive, who have been exposed and may unwittingly be transmitting the virus if they had been infected themselves. According to the data from the city’s H+H Test and Trace about one in four of the contacts traced tests positive.
I need to apologize for the heat maps being out of whack showing negative infection rates for a while – they were feeding on real-time information from the DOH, and at some point, the department did a major cleaning of the data. When we inquired as to how the number of tests could be less at the end of the month than at the beginning, we were told that “testing facilities have input their own address in a field for the patient’s address” resulting in misleading data that they are working to address. The only map that is feeding live data from DOH is the graph that tallies total tests above, the rest are now between set data points and we will keep updating this story with the latest data weekly.