City Finally Releases A More Useful ZIP-code Map For COVID Infections, As Infections Rise
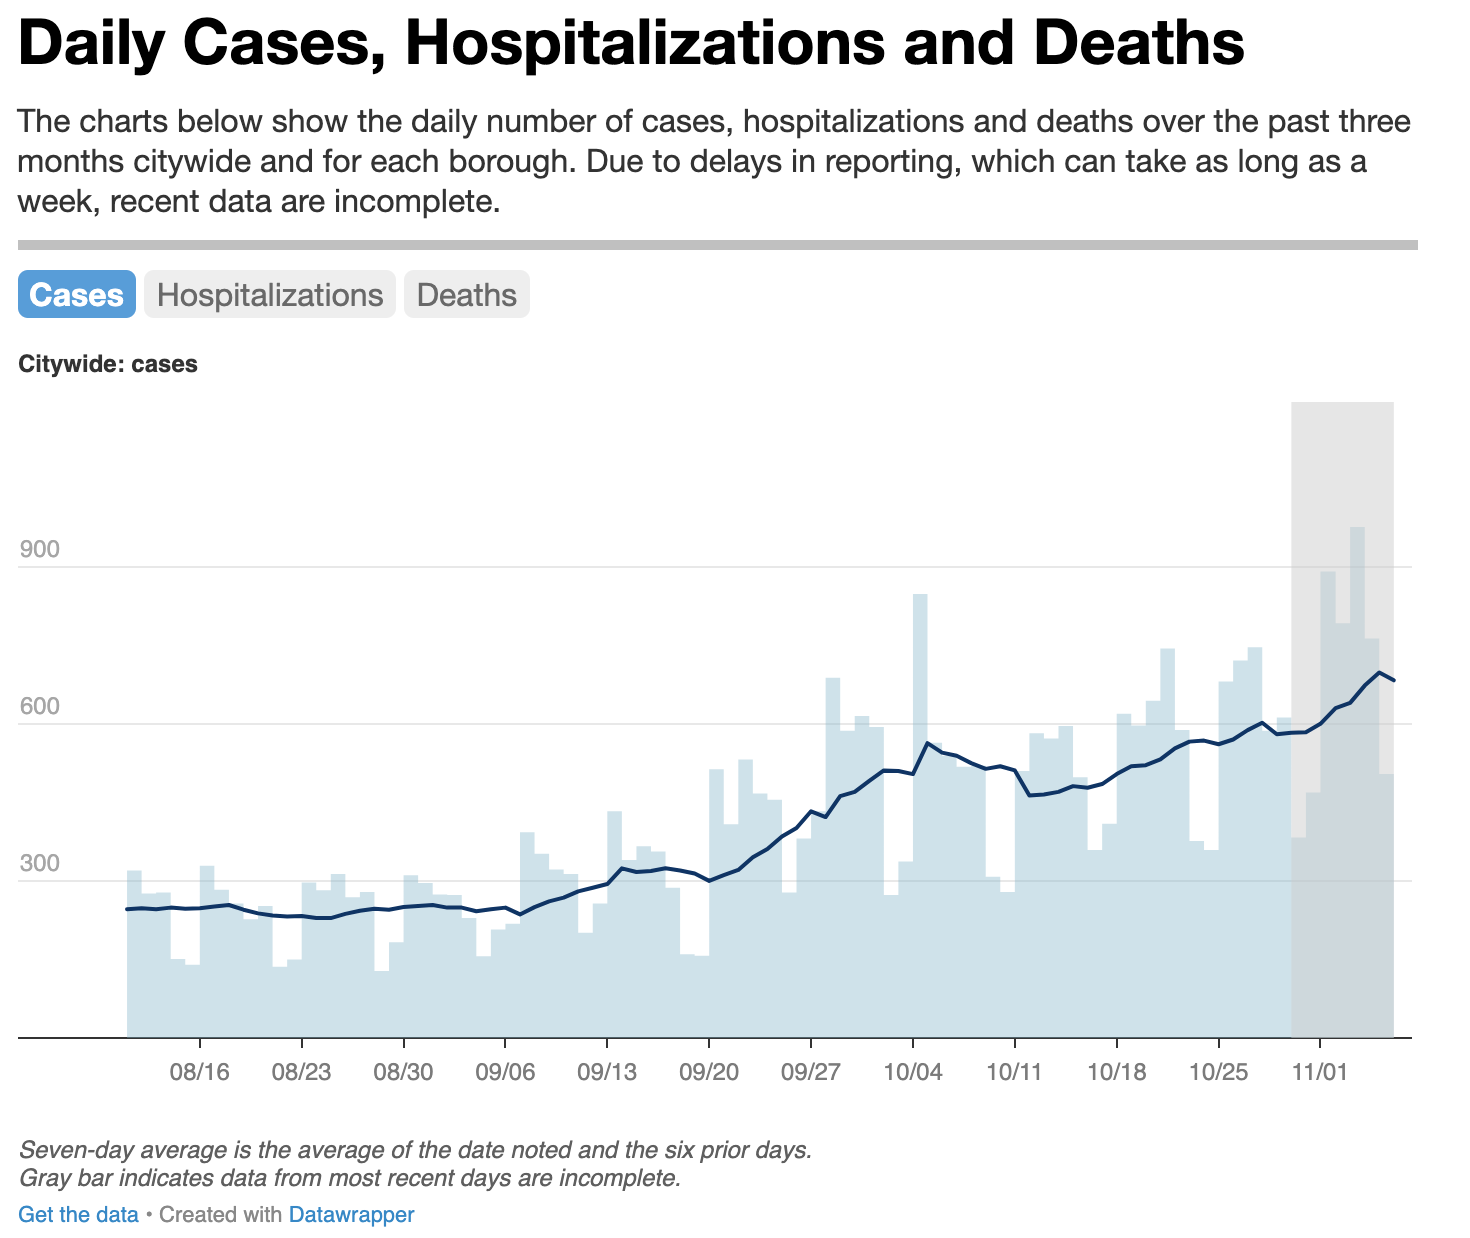
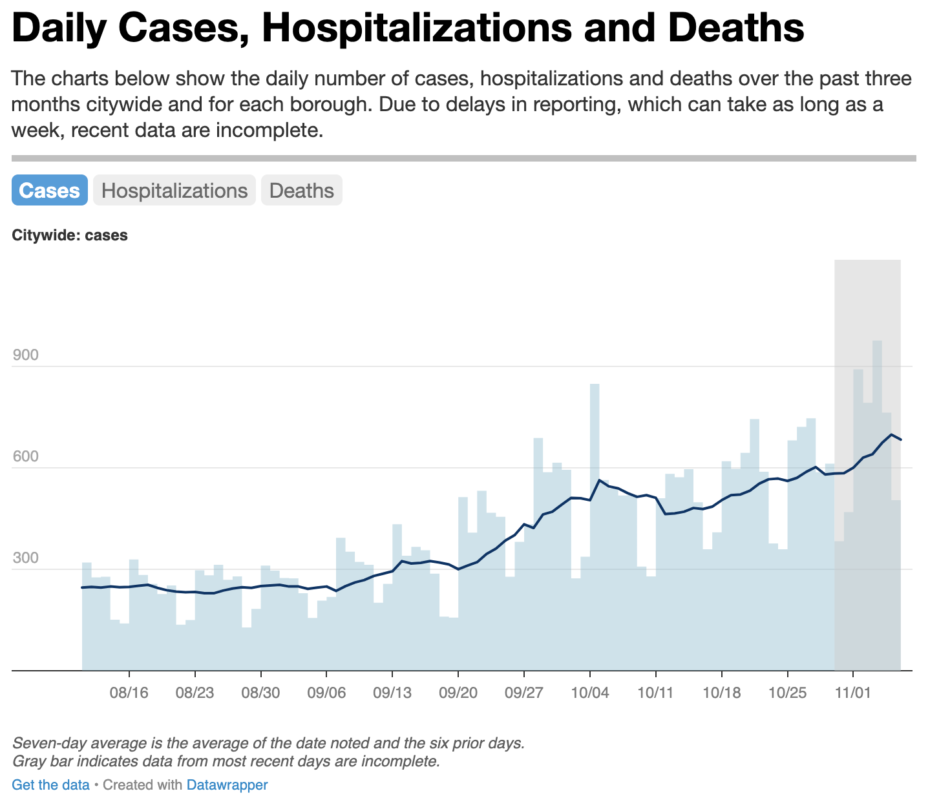
Infection rates citywide have doubled in October, and they keep rising at an alarming rate.
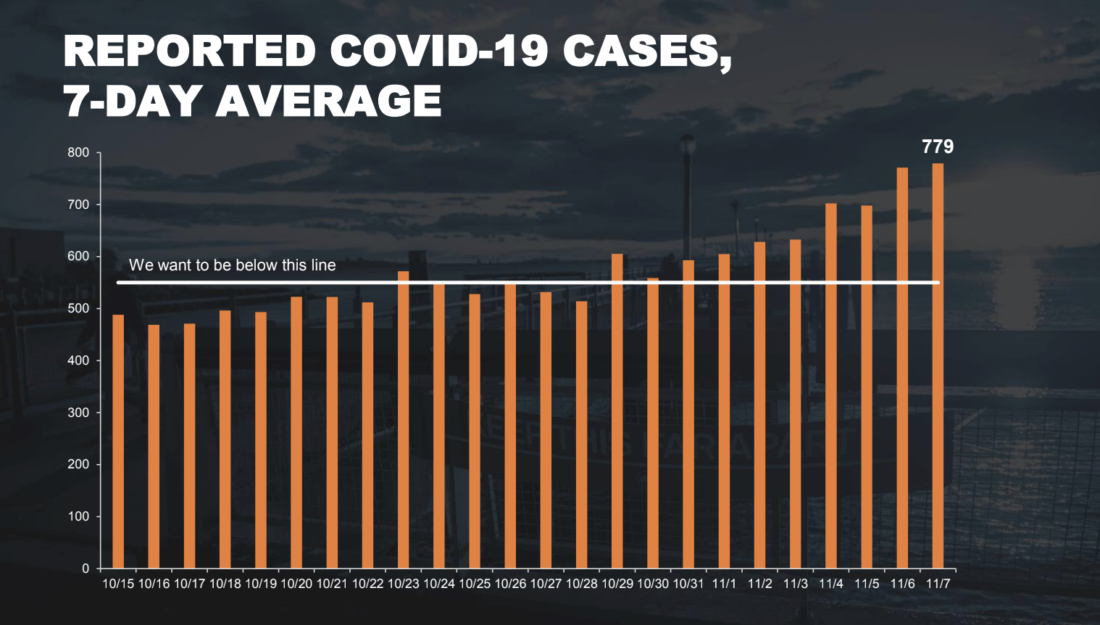
“Unfortunately, we’re seeing a real growth in the positivity rate in this city and that is dangerous. So, we have one last chance to stop a second wave. It’s as simple as this – this is my message to all New Yorkers today – we can stop a second wave if we act immediately, but we have one last chance and everyone has to be a part of it,” Mayor Bill De Blasio warned today. “Just like you fought back the coronavirus after March and April, brought the city back, made it one of the safest places in the country. We have to do that again and we have to act urgently. Citywide positivity now – the positivity level above two percent and it’s been increasing. That is a problem. We have gone well past the threshold for the number of cases we set. The case numbers continue to increase – that as a problem. We’re seeing household transmission, we’re seeing community spread, we’re seeing things we have not seen in a long time and we have to stop them.
What would formally qualify as the second wave?
“What I would say, will unfortunately indicate if we’re in a full-blown second wave would be if those case numbers remain high, if the positivity level goes above three percent on a sustained basis. And if the number of hospitalizations goes up around or beyond that 200 patient-a-day threshold. That would clearly define to me that we are in the second wave.
Remember that map we created months ago to show you where the infection rates were rising in the city? Now the city finally has released a map that shows 7-day averages of both the number of people that tested positive and infection rates in each zip code. Check yours here.
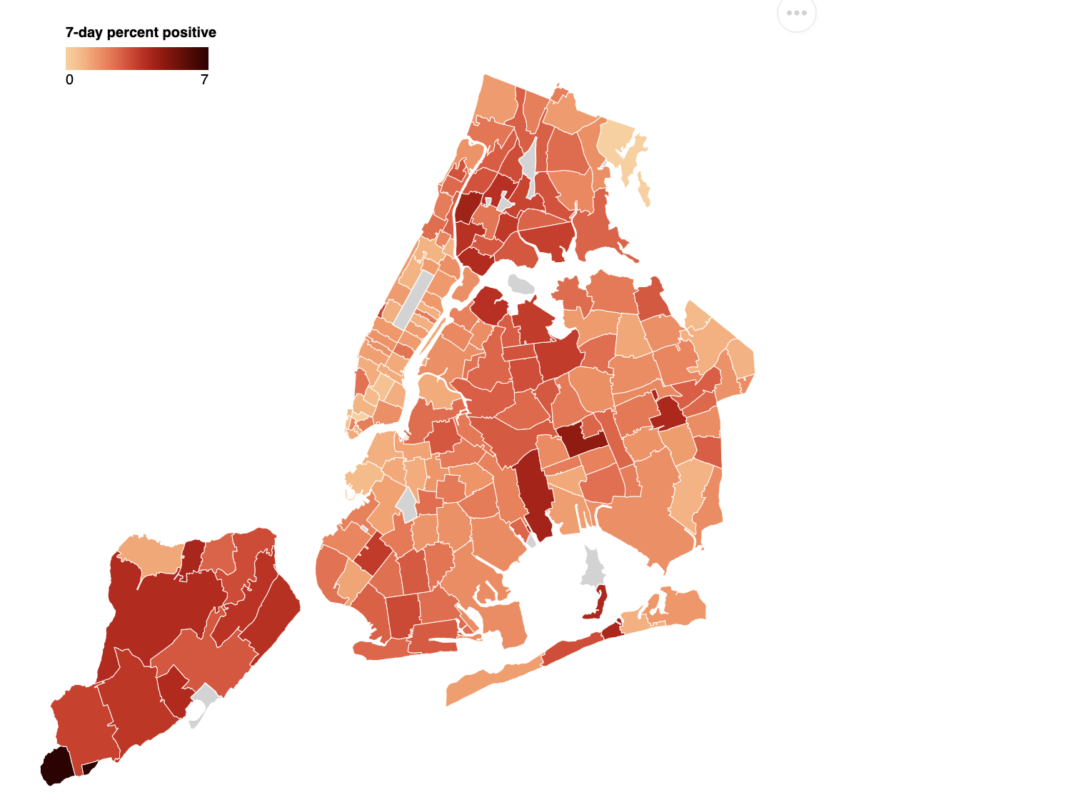
While Brooklyn does not look as bad as Staten Island, more people have been diagnosed positive for the virus in Brooklyn than any other borough – at last 1,422 Brooklynites have tested positive in the last week. (Remember, Brooklyn accounts for about 1/3 of the city’s population).

Three people that the State knows of died in Brooklyn yesterday, that’s down a little from the last few days when we had 4, 5 and 6 deaths a day, but there have been more deaths in the borough, and that seems to be the result on the wave of infections that landed us with the Red-orange and yellow zones.

Screenshot from NYC DOH on 11/9/20 (Shaded areas idicate incomplete data as it is still being processed)Speaking of which, this morning Governor Andrew Cuomo announced that the rates had improved enough to switch the red to orange, with all associated easements on businesses and schools. He just reduced the cluster to 50% last Friday.
Mayor Bill De Blasio said that the schools that were closed due to restrictions, will reopen on Thursday, following Veterans Day which is on November 11.
So, the numbers:
New York State’s COVID-19 positivity rate is 3.72% positive inside the micro-cluster areas and 2.23% positive excluding the focus zones. In NYC, according to Governor, the infection rate in the last three days has been rising as follows:
| BOROUGH | FRIDAY | SATURDAY | SUNDAY |
| Bronx | 2.00% | 3.20% | 2.70% |
| Brooklyn | 1.80% | 1.90% | 2.50% |
| Manhattan | 1.30% | 1.70% | 1.90% |
| Queens | 2.10% | 2.30% | 2.70% |
| Staten Island | 3.00% | 2.90% | 3.80% |
| New York City Average | 1.80% | 2.20% | 2.50% |
Advice?
Wear the masks, only celebrate with your immediate household, and plan on a different kind of holiday season.

