What Does the New Census Data Tell Us About Brooklyn?

New York’s biggest borough just got a little bigger.
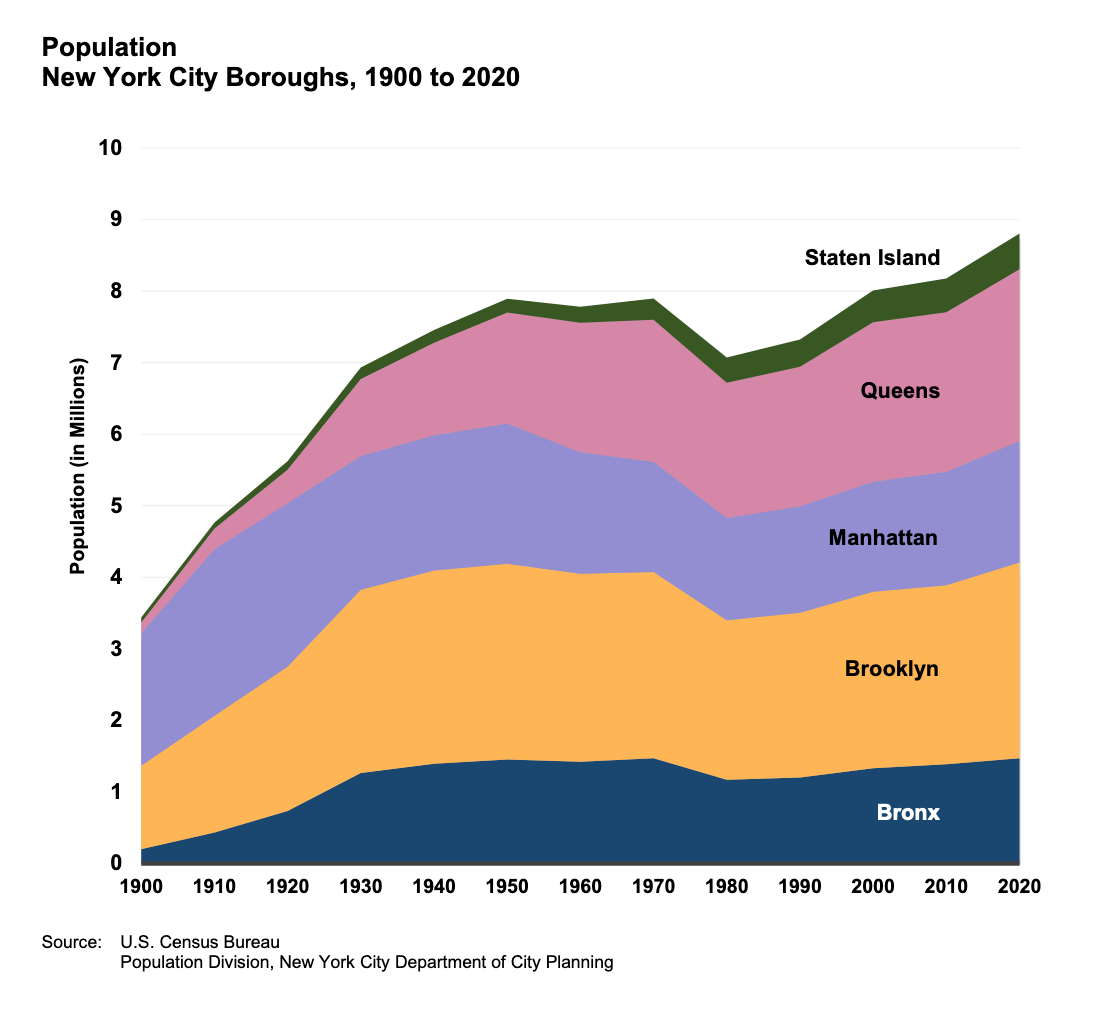
Brooklyn is just 2,100 people shy of its 1950 population peak, according to the NYC Department of City Planning.
Brooklyn grew the most of any of the five boroughs in New York City, according to newly-released 2020 census data, continuing the trends recorded in the last census making the borough overall more diverse.
The census counted 231,374 additional residents, an increase of 9.2% in the decade since 2010, bringing the total population count in Brooklyn from 2.5 million to 2.74 million, keeping Brooklyn the most populous borough in the city. Queens, which jumped 7.8%, from 2.23 million to 2.45 million in the past decade, remains second.
The news of the count was cause for celebration amongst the borough’s officials, including Borough President and Democratic mayoral candidate Eric Adams.
"Brooklyn’s population growth over the last decade — a 9.2% recorded increase in #Census2020 — reflects how hard we’ve worked to make this a safer place to raise healthy children and families," Adams wrote on Twitter. "We have effectively tied Chicago as America’s 3rd largest city."
In fact, all five boroughs grew, pushing the population of the nation’s largest city up by over 629,000 people, to a record-high 8.8 million people. 44% of all residents of New York State now live within the city.
“The Big Apple just got bigger!” Mayor Bill de Blasio tweeted yesterday, thanking “every City worker who made this record-breaking count possible.”
The citywide surge came despite fears that the census, which was conducted during the brutal first wave of the coronavirus pandemic in spring 2020, could undercount the city’s population, potentially costing New York billions in federal aid.
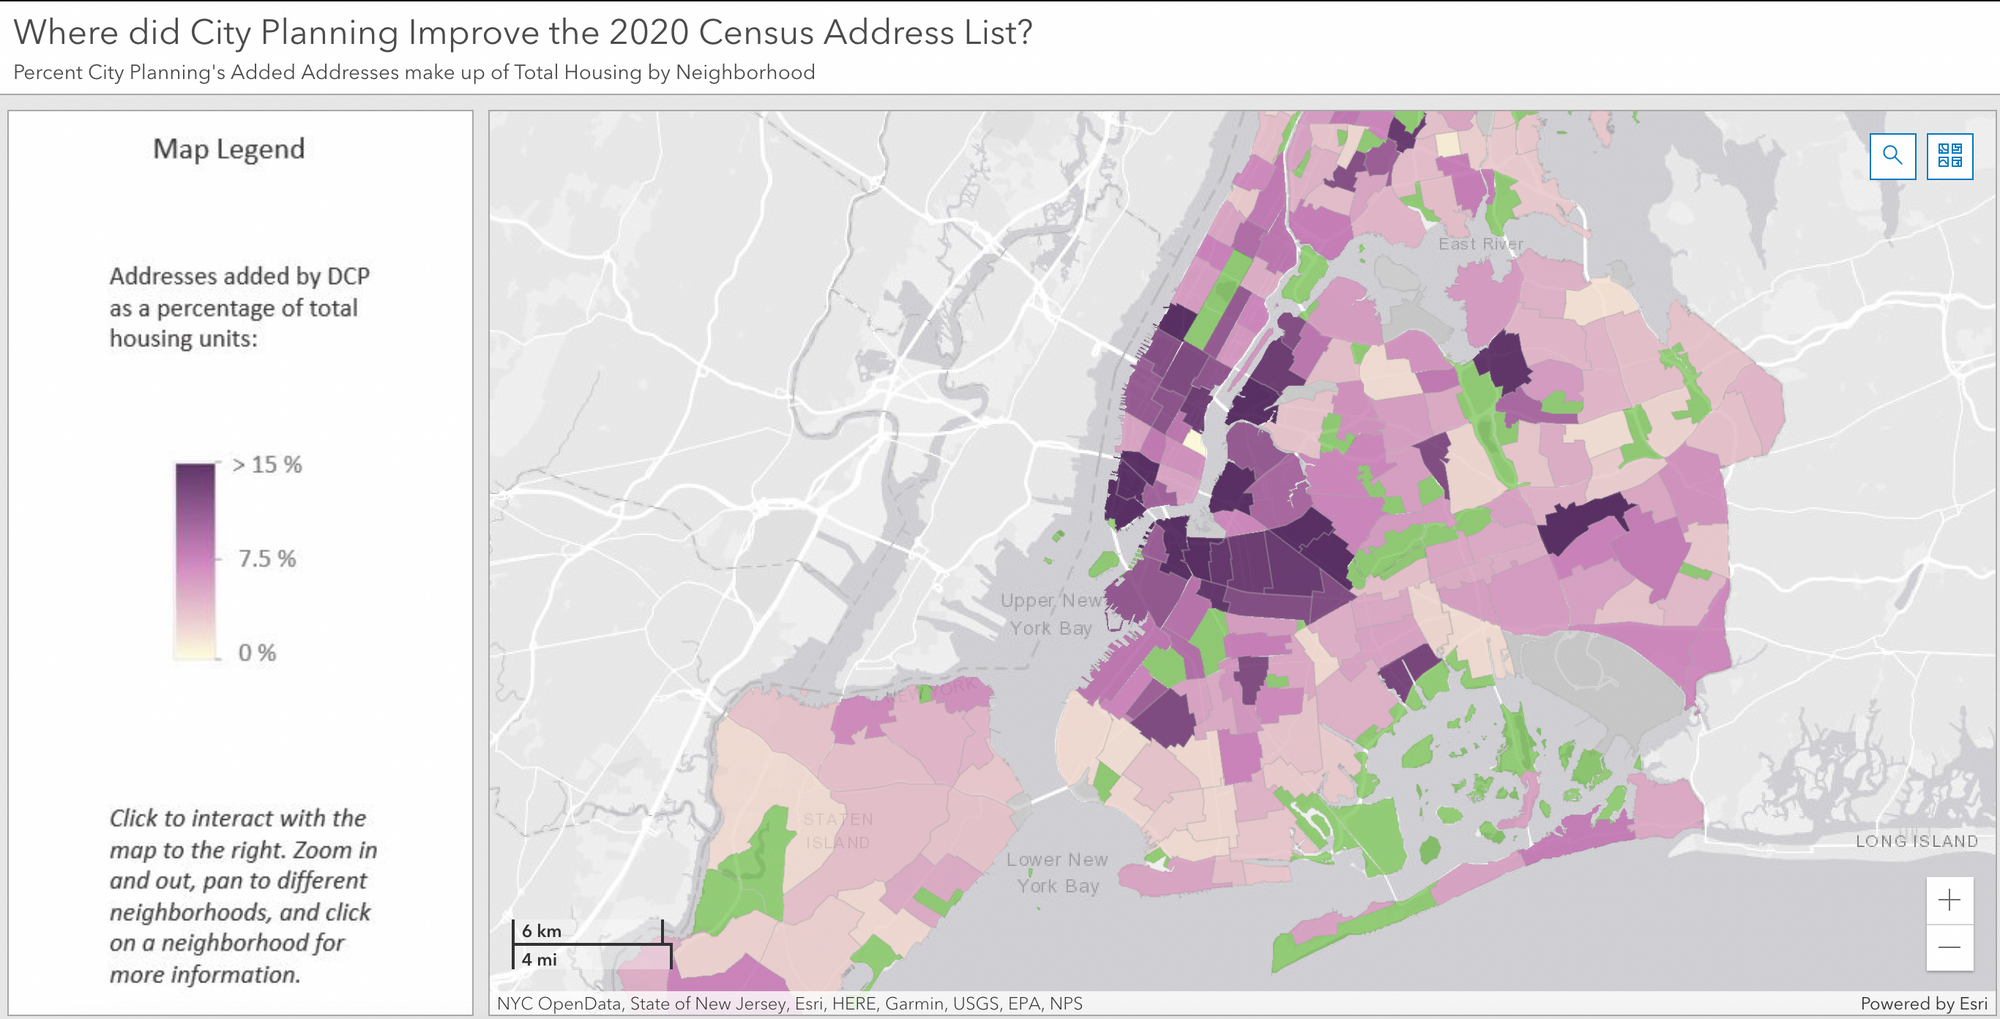
That said, the increase may have also had something to do with efforts by city officials to improve the data itself. The NYC Department of City Planning wrote in an online explainer post that it had identified over 122,000 housing units across the city that hadn’t previously been included in the U.S. Census Bureau’s master file. Many of those were “hard-to-find” units, the department said, often informal subdivisions in small multi-family buildings, and estimated its combined efforts resulted in over 500,000 people to be counted.
The agency also submitted over 140,000 newly-constructed housing units. Many of those units were added in parts of north and central Brooklyn that also saw sizeable population growth.
Digging deeper into the Brooklyn numbers reveals other interesting stats.
Brooklyn’s Asian population is the fastest-growing of any demographic group across the borough; the community’s count in the 2020 census is 373,680, a 42.5% increase from the 2010 population of 262,276. With that increase, Asian-identified people make up 13.7% of the borough’s population, up from 10.5% in 2010.
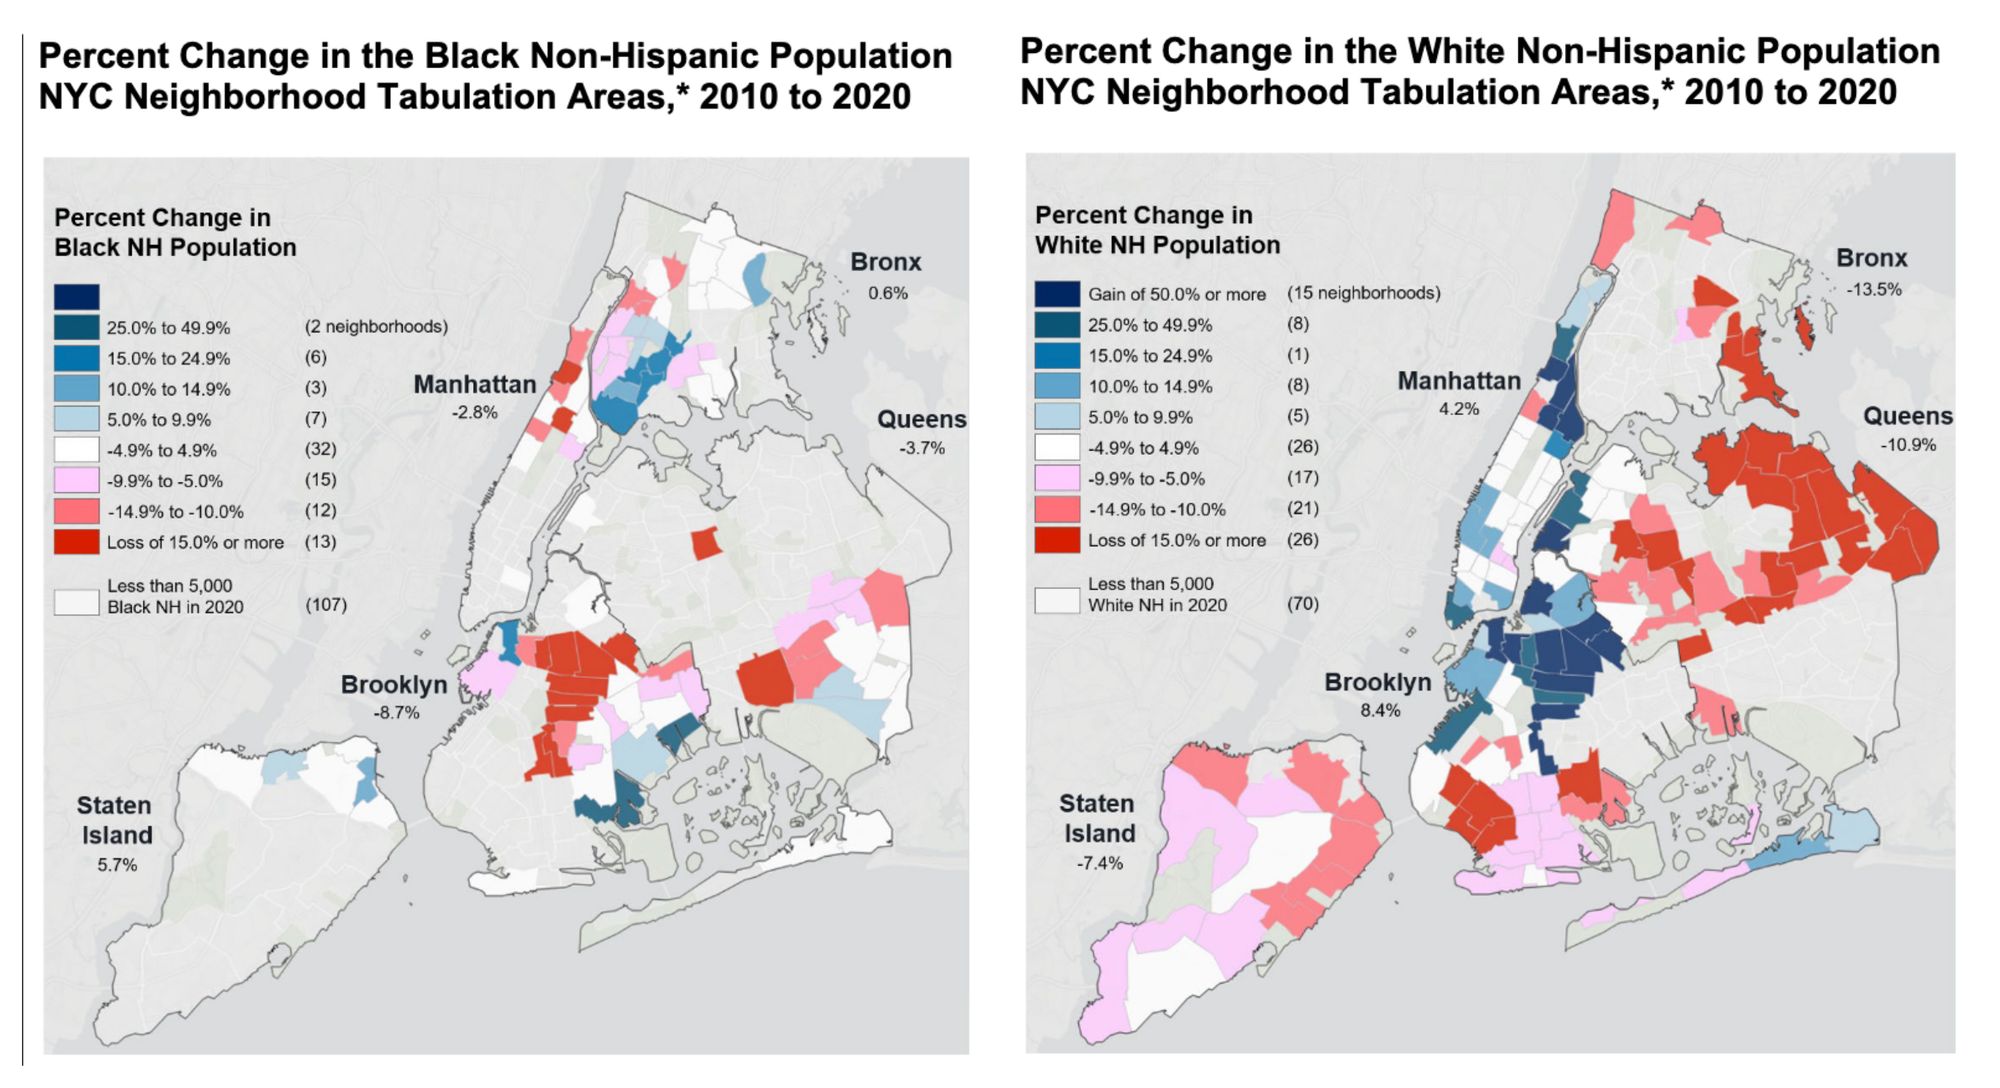
Brooklyn’s Black population, meanwhile, dropped another 8.7% in the last decade, from 799,066 to 729,696. The community now makes up 26.7% of the borough’s population, down from just under 32% percent. That continues a trend from the previous decade, when percentage of Brooklyn's black population fell from 34.4%
The borough’s white population grew 8.4%, from 893,306 to 968,427. But their share of Brooklyn's overall population declined slightly from 35.7% to 35.4%.
Maps from the NYC Department of City Planning show that the white population grew in several neighborhoods in central Brooklyn, while the Black population in those neighborhoods shrank, continuing the trend from 2000-2010. Several predominantly white neighborhoods in southern Brooklyn, meanwhile, became less white.
The number of Brooklynites identifying as Hispanic and Latino also grew about 4.1%, from 496,285 to 516,426. But the group’s share of the borough’s total population also fell slightly, from 19.8% to 18.9%.
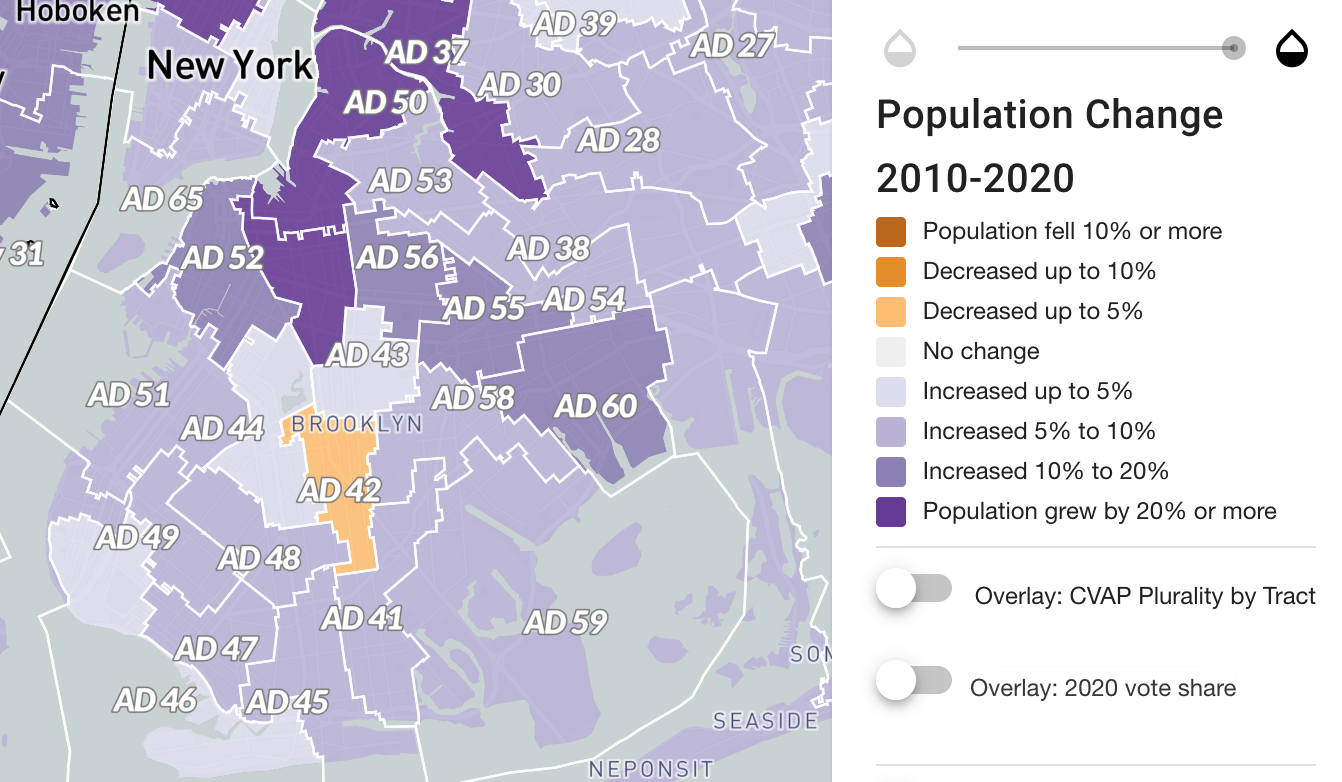
Besides race and ethnicity, the shifts in population also showed geographic differences. The borough saw the largest population growth in two Assembly Districts: AD50 and AD57.
In AD50, which encompasses north Brooklyn neighborhoods like Greenpoint and Williamsburg, the population grew about 26%, from 124,059 residents to 156,296. Bordering AD57, which includes Fort Greene, Clinton Hill Prospect Heights and parts of Crown Heights, the population grew 20.9%, from 123,531 residents to 149,364.
One analysis by the NYC Department of City Planning finds that the specific neighborhoods with the largest population growth, including Downtown Brooklyn-DUMBO-Boerum Hill (67% growth), and Williamsburg (41%) were also the ones with the largest numbers of newly constructed housing units during the 2010s.
Another by the writer Samuel Stern suggests the growth was driven at least in part by the burgeoning Orthodox Jewish population in Williamsburg.
My prelim analysis of Census results for Hasidic Williamsburg area census tracts shows a growth of 21.3% in a decade (78,980 vs 65,100), vs. 9.25% for Brooklyn. This reflects strong census drive by @UnitedJewish with NYC Census @JulieMenin @JasonReischel @katiebrens & team pic.twitter.com/ytMWJyIgH5
— Samuel Stern (@samuelmstern) August 13, 2021
Every Assembly district in the borough saw overall population growth except one: AD42, which includes large swathes of Flatbush, East Flatbush and Midwood. That district's population shrank by 107 people, the data shows, from 123,835 to 123,728.
Steven Romalewski, Director of the CUNY Mapping Service at the Center for Urban Research, which produced initial mapped analyses of the data, said the decrease in the population in AD42 was small enough that "even though it stands out on the map, I don’t think it’s a major trend or notable change."
"Remember that the changes are net changes, which is especially important to keep in mind at the district level," he told Bklyner in an email. "It’s possible that in this district and in others, local areas (census tracts) had population losses. It’s just that in other districts, the gains were enough to offset the losses, and apparently in this district the gains were just shy of the losses."
But Assembly Member Rodneyse Bichotte-Hermelyn, who represents the district, suggested anti-immigrant rhetoric from former President Donald Trump, along with challenges posed by the pandemic, were responsible for a depressed count in the area.
"Our district is home to a large immigrant population," she said. "Last year, we partnered with the Census for dozens of outreach events and sensed residents' reluctance to participate due to anti-immigration rhetoric and policies coming out of the Trump administration."
"At the same time, we were also feeling the full weight of the COVID-19 pandemic. While residents of more affluent districts filled out the Census online, residents here struggled with some of the highest fatality and infection rates of anywhere in the borough, and high unemployment rates which led to exponential digital divide issues," Bichotte-Hermelyn continued. "Like other high-immigrant districts, this resulted in a lower count. I think we can attribute this to those factors.”
The Census numbers are used to determine how federal funding is distributed, and are also important for redrawing congressional and state legislative boundaries in a process known as redistricting.
In April, New York State learned that it lost a congressional seat based on census data showing that its population represented a smaller proportion of the nation's overall population. The new, more detailed data released by the U.S. Census Bureau will guide a 10-member state reapportionment commission in redrawing the state’s districts to account for population shifts.