B Train Delays Increased Nearly Twofold From 2011 To 2013


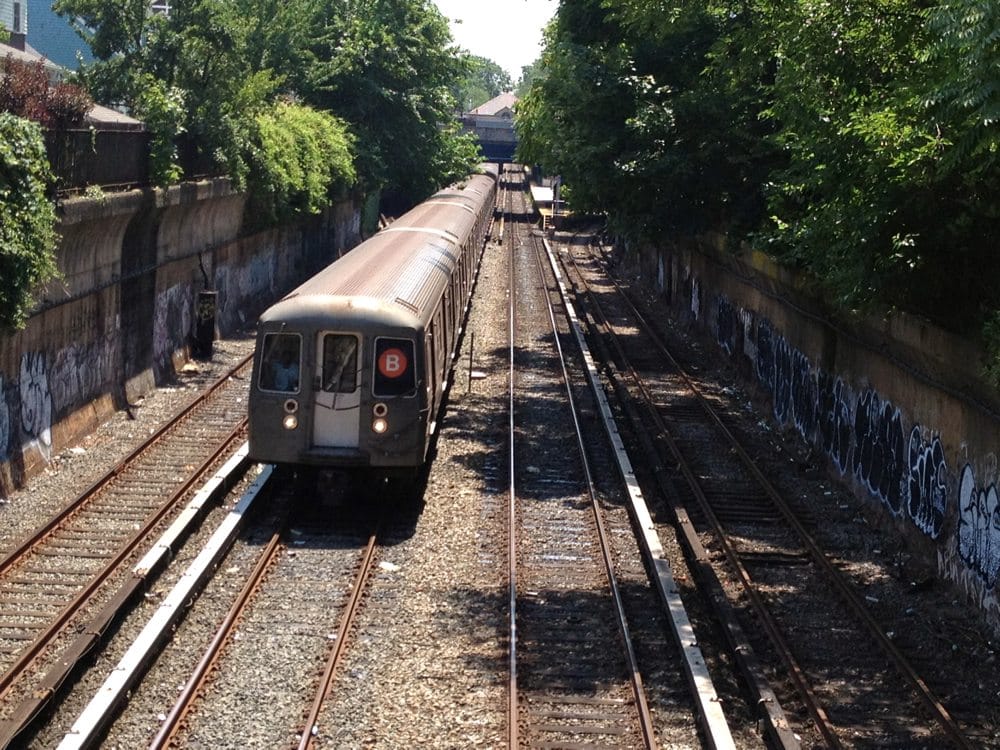
Controllable delays on the B subway line increased from 78 in 2011 to 148 in 2013, according to a new report released by the Straphangers Campaign.
While only 4% the 3,998 delays recorded citywide last year were on the B, incidents on the line were up a whopping 90%. And does anybody care about the F train’s 8% or 2, 4, 5, D, or N’s 7% claim to overall delays when they’re just trying to catch a ride from Newkirk Plaza?
The data analyzed by the Straphangers Campaign covers delays deemed “controllable” by the MTA, including mechanical, switch, track, and other problems but excluding incidents like sick passengers. While the Q experienced a larger percentage of 2013’s total delays (6%), the line only worsened by 37%, from 170 delays in 2011 to 233 in 2013–so maybe, at least, Q riders were already relatively prepared.
From 2011 to 2013, controllable subway delays rose 35% citywide, with 39% of those delays in Brooklyn. The campaign skipped over 2012 because of delays caused by Hurricane Sandy.
Whether you choose to pack extra water, energy bars, and a sleeping bag in your purse is at your own discretion, though, because the MTA says while delay alert numbers may have increased, overall waiting time hasn’t.
“Since 2011, the amount of time customers have had to wait for a train throughout the system has remained flat,” the MTA told the Daily News.
As there is no recorded data about how long individual delays last, we’ll maybe just hang onto our trail mix for now.
[poll id=”93″]


