B And 5 Lines Rank As Worst In The Subway System; A, C, And G Have Their Pros And Cons

The Straphanger’s Campaign rated the B line as the worst in New York City’s subway system — tied for the bottom slot with the 5 line — in their annual State of the Subways Report Card, while the 7 line came in with the highest scores for cleanliness and frequency of service.
The B line placed last for having the worst in-car announcements than any other subway and for having more than average delays caused by mechanical failures. The train line was also criticized for the infrequency of arrival times and for not running at night.
On the positive side, B train riders were more likely than average to find a seat on the subway car.
As for lines that service Fort Greene and Clinton Hill, the G line was not given a rating because the MTA lacked data on the number of subway riders for that line.
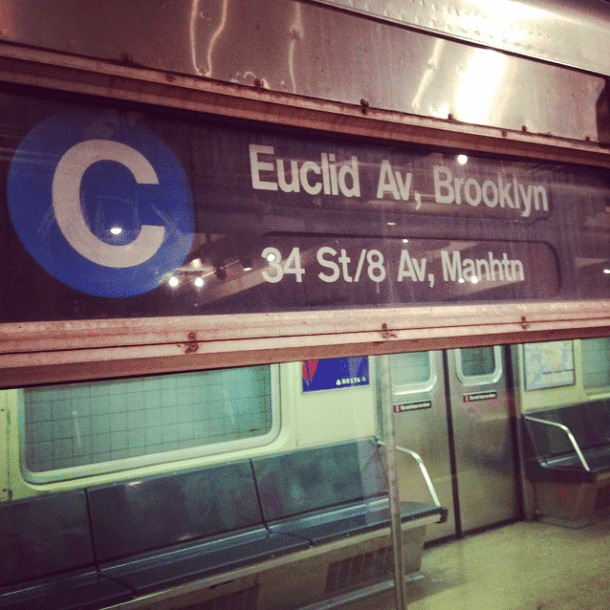
The A line was described by riders as cleaner than average, but less frequent and easily broken. Surprisingly for some riders, the C line ranked pretty decently for regularity of service, although riders said the old cars break down often.
The report ranks 19 of the 20 subway lines. Using data from the MTA, taken from December 2013 to December 2014, the Straphangers Campaign evaluated train lines based on car cleanliness, available seats, amount of breakdowns, frequency and regularity of service and the quality of announcements in the cars.
Each category was weighted based on it’s importance to commuters, with the amount of service receiving the greatest priority while seat availability, cleanliness, and announcements given the least significance.
Systemwide, for 20 lines, we found the following on three of the six measures we can compare over time: car breakdowns, car cleanliness and in-car announcements.
a) The car breakdown rate worsened from an average mechanical failure every 153,382 miles to every 141,202 miles comparing the 12-month period ending December 2013 to December 2014 – a loss of 7.9%. This continues a trend: In our 2014 report, we found an 11% increase in subway car breakdowns. We found that thirteen lines declined (1, 3, 4, 5, 6, 7, A, B, D, F, M, N and Q), and seven improved (2, C, E, G, J/Z, L and R.
b) Subway cars rated clean remained unchanged at 92% in both our 2014 and 2015 reports. We found that eleven lines declined (1, 3, 5, A, C, F, J/Z, L, M, N and R); six improved (4, 6, 7, D, G and Q) and three remained unchanged (2, B and E).
c) Accurate and understandable subway car announcements declined very slightly, going from 92% in our last report to 91% in the current report – a decrease of 1.1%. We found six lines improved (4, 7, A, C, G and N), eight declined (3, 6, B, D, F, J/Z, Q and R) and six did not change (1, 2, 5, E, L and M).
The Straphanger Campaign said the purpose of the report is to make information about train quality easily accessible to riders.They also argued the report provides greater transparency for the subway system and gives riders the information they need to win better service.
The report concluded that, overall, subway car breakdowns have increased over the previous year. Car cleanliness has not improved since last year’s report and the amount of “accurate and understandable” in-car announcements have worsened slightly.
Earlier this year, the MTA asked the city to chip in an extra $1.3 billion to address a $14 billion funding gap in its five-year capital construction plan, which goes towards the Second Avenue Subway line and improving the transit system’s aging infrastructure, the New York Times reports.
City Comptroller Scott Stringer called the request “incredible” after releasing a report showing New York City residents contributed $10.1 billion to the MTA in fiscal year 2014 through fares, tolls, taxes, and other subsidies, reports Crain’s. Meanwhile, the state, which controls the MTA, contributed only $603.5 million in fiscal year 2014.