Preliminary FEMA Flood Maps & What They Show About Fort Greene


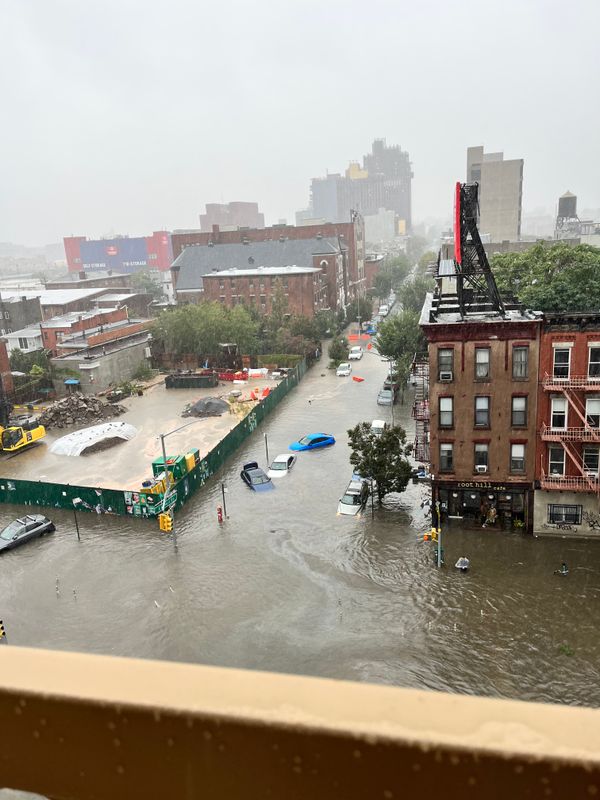
As the southern East Coast braces for the arrival of Hurricane Matthew, we thought it would be useful to return to the topic of climate resiliency in our part of Brooklyn.
In January, 2015, the Federal Emergency Management Agency (FEMA) released preliminary versions of new flood insurance rate maps for all of New York City.
Those draft flood maps significantly expanded New York City’s flood plain. “Properties included in the expanded flood zones have jumped from 23,885 structures in 2010 to 84,596 in 2013—an increase of more than 60,000 buildings,” according to NY Environment Report.
The largest increase came in Brooklyn: more than 42,000 structures are now identified as at-risk, compared to the previous 5,648, NYER adds.
Flood Plain Crosses Flushing Avenue
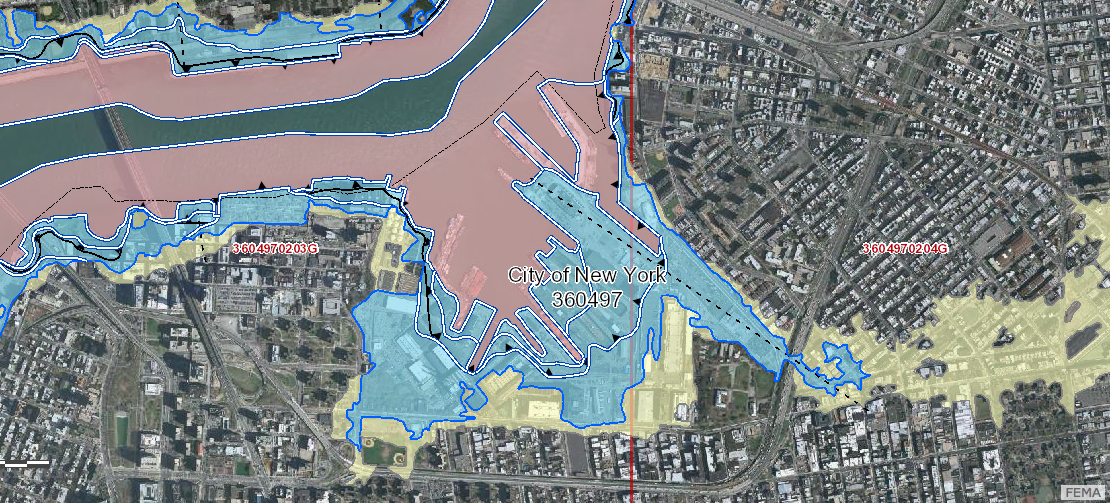
Here is FEMA’s preliminary analysis of the coastal flood risk in the Fort Greene area.
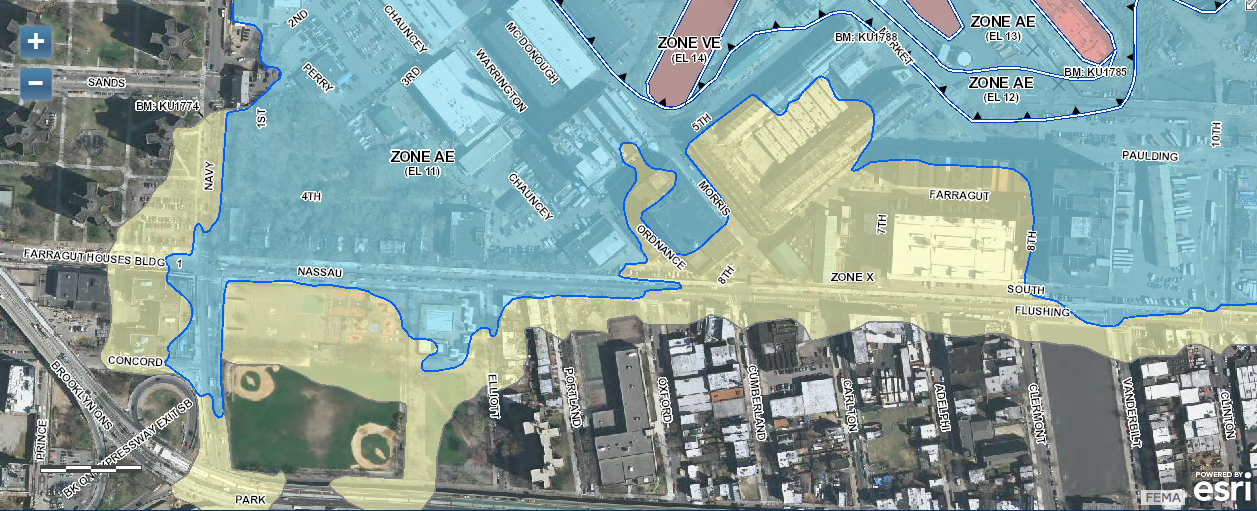
The map section above shows Flushing (also called Nassau) Avenue, bounded by Navy Street to the west, and 10th (Clinton) Avenue to the east.
The blue line signifies the boundary for areas that have a 1 percent chance of coastal flooding every year. As you can see, the blue line crosses Flushing Avenue at Navy Street, St. Edward’s Street, N. Elliott Place and Vanderbilt Avenue.
The blue line also appears to come quite close to Building 1 of the Farragut Houses.
Red shaded areas — seen in the Brooklyn Navy Yard — indicate a VE zone: “an area of high flood risk subject to inundation by the 1 percent annual-chance flood event — with additional hazards due to storm-induced velocity wave action (a 3-foot or higher breaking wave).” These areas are at risk of both flooding and storm surge.
Blue shaded areas indicate an AE zone: “an area of high flood risk subject to inundation by the 1 percent annual-chance flood event.”
Below you can see more of the same, heading along Flushing Avenue toward Williamsburg.
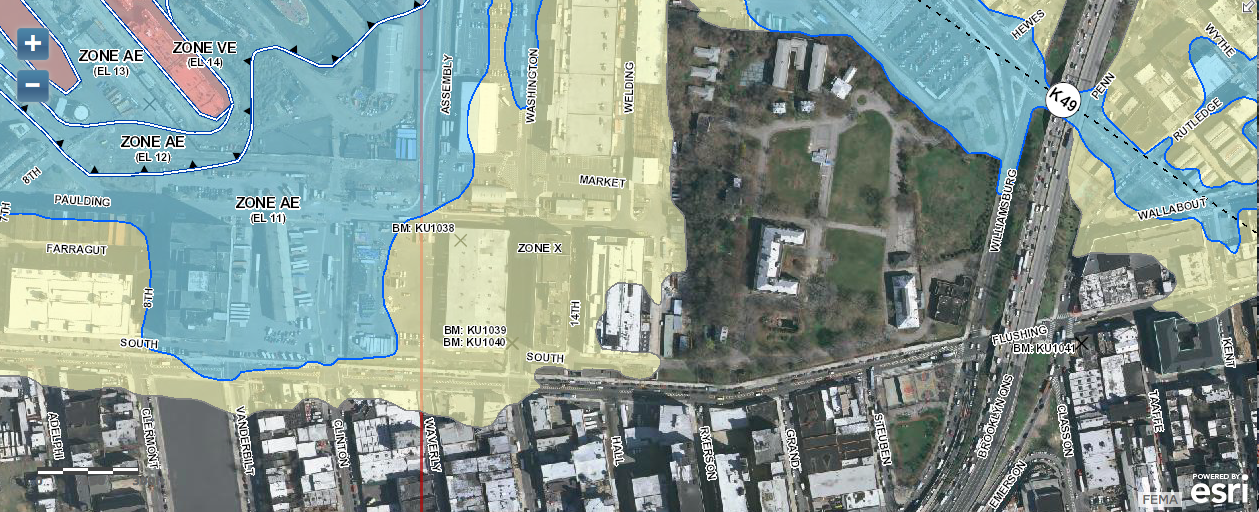
All of the yellow shaded areas are considered by FEMA to have a .2 percent annual chance of coastal flooding.
The red and blue areas — with a 1 percent annual chance of flooding — are called Special Flood Hazard Areas (SFHAs).
Read more about these FEMA terms here.
It is very important to note that the SFHA’s demarcate zones where “the National Flood Insurance Program’s (NFIP’s) floodplain management regulations must be enforced and the area where the mandatory purchase of flood insurance applies,” says FEMA.
In other words, once these maps are finalized, building owners in areas that are deemed to have a one-percent annual chance of flooding will need to purchase flood insurance, and may have to take other steps to make their buildings more flood resilient.
City Challenges FEMA’s Maps
The de Blasio administration filed a challenge to FEMA’s preliminary maps in the summer of 2015, saying that the maps are:
“not accurate. The impact of the technical and scientific errors identified in the City’s analysis is significant. Specifically, FEMA’s preliminary FIRMS overstate Base Flood Elevations (BFEs) by more than two feet in many areas across New York City and misrepresent the Special Flood Hazard Area (SFHA) by 35 percent, unnecessarily putting approximately 26,000 buildings and 170,000 residents in the SFHA.
This overestimation would have three important consequences.
First, homeowners in the SFHA who invest in their homes could end up building or rebuilding to excessive heights at extra cost, with additional impacts on neighborhood character. Second, many homeowners in the SFHA would be asked to pay flood insurance premiums based on incorrect BFEs, causing an affordability challenge. And third, many homeowners that would otherwise not be in the SFHA, would be required to pay for flood insurance at higher rates, further exacerbating that affordability challenge.”
We spoke with FEMA’s Region 2 office today, and they stated that FEMA and the City are working “in tandem” to address the discrepancy between FEMA’s and the City’s analysis of coastal flood risk. An announcement about the new maps will be made by the end of the year, FEMA said.
Resolving the dispute between the City and the Feds about the degree of risk of coastal flooding is urgent — an analysis published by the City’s scientists last year found that since 1900, New York City has seen sea levels rise around 12 inches—nearly twice the observed global rate over a similar time period.
This trend is expected to continue, and even accelerate, as the 21st century progresses. According to the City’s report, area sea level could rise 11 to 21 inches by the 2050s.